Grow · Findings · Updated: 20 October 2026
What the data says
Five crosses you will not find in any bulletin: where today's price sits against ten years, what Salto's window is worth and whether it is growing, which crops collapse when everyone harvests at once, what the Central Hortícola looks like from Montevideo, and how many kilometres are saved. With the method and the limits in plain view, and the files to redo every sum.
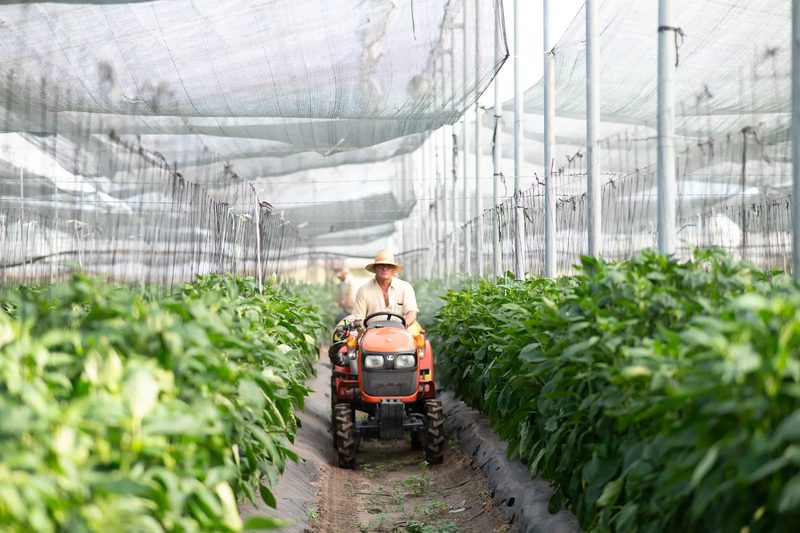
Work under cover · photo: Marcelo Cattani
01 / 07
October 2026 against ten Octobers
For every Salto product with enough history, the UAM wholesale price of October 2026 next to the ten previous Octobers (2016–2025), all in constant pesos of August 2026 (INE consumer price index). The percentile says where this year falls within that decade: 100 is the dearest, 0 the cheapest. The real year-on-year change strips out inflation (4.6 % over twelve months). The cross avoids the commonest mistake when reading prices: comparing only against last year.
Context the tables cannot show: in the early hours of 18 July 2026 a storm with winds above 120 km/h damaged some 150 hectares of greenhouses in Salto's horticultural belt and hit around 300 growers (Ámbito, 22 July). According to the UAM, close to half of the yearly supply of tomato, pepper, aubergine, cucumber, courgette, strawberry and zapallito sold in Montevideo comes from the littoral (Subrayado, 21 July), and the market itself expected high prices until year end (Telenoche, 27 July). This table is how that effect gets measured month by month instead of described with adjectives.
| Product | $/kg October | Real YoY | vs decade median | Percentile |
|---|---|---|---|---|
| Berenjena | 141.7 | +232 % | +129 % | 100 |
| Arándanos | 876.9 | +45 % | +113 % | 100 |
| Frutilla | 202.5 | +72 % | +95 % | 100 |
| Morrón Verde | 159.4 | +64 % | +77 % | 100 |
| Chaucha Chata | 188.8 | +78 % | +67 % | 100 |
| Tomate Redondo | 151.7 | +58 % | +62 % | 100 |
| Tomate Perita | 200.0 | +36 % | +49 % | 100 |
| Zapallito | 54.2 | +115 % | +48 % | 90 |
| Tomate Cherry | 186.7 | +83 % | +27 % | 80 |
| Morrón Rojo | 135.8 | +4 % | +7 % | 70 |
| Boniato Criollo | 55.1 | +213 % | +15 % | 67 |
| Naranja Navel/Ombligo | 26.8 | −11 % | +7 % | 67 |
| Zapallo Kabutiá | 41.4 | +120 % | +55 % | 60 |
| Cebolla | 58.8 | +9 % | +16 % | 60 |
| Calabacín | 41.2 | +88 % | +9 % | 60 |
| Morrón Amarillo | 157.9 | −24 % | +3 % | 50 |
| Cebolla Roja | 75.0 | +2 % | +1 % | 50 |
| Boniato Zanahoria | 42.5 | +46 % | −18 % | 40 |
| Naranja Valencia | 21.3 | −25 % | −13 % | 33 |
| Limón | 18.3 | −44 % | −19 % | 20 |
| Zapallo Criollo | 25.0 | +3 % | −19 % | 10 |
| Pepino | 29.4 | −23 % | −35 % | 10 |
| Mandarina Murcott | 29.5 | −48 % | −23 % | 0 |
| Cebolla Verdeo | 350.0 | −25 % | −25 % | 0 |
| Pomelo Blanco | 28.8 | — | −26 % | 0 |
| Mandarina Ellendale | 20.0 | — | −27 % | 0 |
| Pomelo Rosado | 27.5 | −68 % | −57 % | 0 |
Reference-row prices (grade I, medium size, Uruguayan produce); a preliminary month is the average of 6 bulletins and is replaced by the official figure when it comes out. Deflated with INE's headline CPI to August 2026 pesos; months after the latest published CPI use the latest index. Only products with at least six Octobers in the decade.
02 / 07
Salto's window: when it is, what it is worth, and whether it moved
Salto lives off counter-season: selling when the south has none. For each product, the window is the set of months when the wholesale price sits at least 10% above its annual mean (seasonal index), computed separately for 2015–19 and for 2021–25. The premium is how much dearer the window's average price is than the rest of the year, each period with its own window. That separates two different things: whether the window moved to other months, and whether it pays more or less than a decade ago. Being a within-year ratio, inflation does not touch it. The volume column shows what share of the year's UAM entries arrives in the current window: the smaller, the more of an early-crop window it is. 21 products with a window defined in both periods.
| Product | Window 2015–19 | Window 2021–25 | UAM volume in window | Premium 2015–19 | Premium 2021–25 | Trend |
|---|---|---|---|---|---|---|
| Zapallito | May–Jun–Jul–Aug–Sep | Jun–Jul–Aug | 16 % | 157 % | 153 % | −4 pts |
| Limón | Jan, Feb, Mar, Apr, Dec | Jan, Feb, Mar, Apr, Dec | 48 % | 169 % | 132 % | −37 pts |
| Pomelo Blanco | Jan, Feb, Mar, Nov, Dec | Jan, Feb, Mar, Dec | 34 % | 163 % | 122 % | −41 pts |
| Cebolla Roja | Aug–Sep–Oct–Nov | Jul–Aug–Sep–Oct | 24 % | 116 % | 95 % | −21 pts |
| Frutilla | Apr–May–Jun–Jul | Mar–Apr–May | 5 % | 46 % | 89 % | +43 pts |
| Pepino | Jun–Jul–Aug–Sep | Jun–Jul–Aug–Sep | 19 % | 99 % | 83 % | −16 pts |
| Pomelo Rosado | Jan, Feb, Mar, Nov, Dec | Jan, Feb, Mar, Apr, Dec | 39 % | 104 % | 76 % | −28 pts |
| Tomate Cherry | Jul–Aug–Sep–Oct | Mar, Apr, May, Sep | 24 % | 79 % | 71 % | −8 pts |
| Calabacín | Oct–Nov–Dec | Sep–Oct–Nov–Dec | 35 % | 97 % | 68 % | −29 pts |
| Tomate Redondo | Aug–Sep–Oct | Mar, Apr, May, Sep, Oct | 38 % | 46 % | 68 % | +22 pts |
| Tomate Perita | Jul–Aug–Sep–Oct | Apr, May, Sep, Oct | 23 % | 64 % | 65 % | +1 pts |
| Morrón Verde | Jun–Jul–Aug–Sep–Oct | Jul–Aug–Sep–Oct | 33 % | 73 % | 64 % | −9 pts |
| Cebolla Verdeo | Mar, Apr | Feb–Mar–Apr | 12 % | 47 % | 63 % | +16 pts |
| Zapallo Kabutiá | Oct–Nov–Dec | Oct–Nov–Dec | 23 % | 68 % | 61 % | −7 pts |
| Morrón Rojo | Jun–Jul–Aug–Sep–Oct–Nov | Apr, May, Jun, Sep, Oct | 40 % | 85 % | 58 % | −27 pts |
| Boniato Zanahoria | Jan, Nov, Dec | Jan, Oct, Nov, Dec | 29 % | 38 % | 57 % | +19 pts |
| Berenjena | Jun–Jul–Aug–Sep–Oct | Jul–Aug–Sep | 24 % | 98 % | 50 % | −48 pts |
| Cebolla | Aug–Sep–Oct–Nov | Jun–Jul–Aug–Sep–Oct | 44 % | 72 % | 48 % | −24 pts |
| Chaucha Chata | Jul–Aug–Sep | Feb, Jul, Aug, Sep | 15 % | 79 % | 48 % | −31 pts |
| Morrón Amarillo | Jul–Aug–Sep–Oct–Nov | May, Jun, Sep, Oct, Nov | 40 % | 56 % | 44 % | −12 pts |
| Melón Amarillo | Jun–Jul–Aug | Jun, Jul, Sep, Oct | 22 % | 27 % | 24 % | −3 pts |
Seasonal index: month average over year average, per product and year, averaged over the period. Window: months with index ≥ 110 in each period (products with no window, or more than six months, in either period are dropped). Premium: mean index inside the window over mean index outside it, minus one. Volume: average 2021–25 share of the current window's months in yearly UAM entries. In terracotta, products whose window shares less than half of its months between the two periods. Correction of 7 September 2026: the first version of this table applied the current window to 2015–19, which overstated the rise of the premium for tomato and pepper (it measured the shift of the window, not the premium); the JSON file keeps both measures.
03 / 07
What collapses when everyone harvests at once
Two measures per product, crossed with what is being planted. Volatility is the coefficient of variation of the monthly real price in 2021–25: how much the price moves within and between years. The price–volume correlation (2015–25, in logs) measures how far the price drops when more produce enters the UAM: near −1, the price sinks in step with supply; near 0, the price holds even when a lot comes in. A product with a strongly negative correlation is one where planting what everyone else plants costs the most. The table takes the hectares of the planting-intention survey for winter 2026 (planted plus intended, 1,395.3 ha surveyed; in Spanish) and, for each crop, the highest-volume Salto product as reference.
| Crop | ha 2026 | % of area | Reference product | Volatility | Correlation | Risk |
|---|---|---|---|---|---|---|
| Boniato | 380.5 | 27 % | Boniato Criollo | 46 % | −0.38 | medium |
| Calabacín | 167.7 | 12 % | Calabacín | 54 % | −0.01 | medium |
| Cebolla | 155.7 | 11 % | Cebolla | 46 % | −0.15 | medium |
| Tomate | 124.6 | 9 % | Tomate Redondo | 44 % | −0.46 | high |
| Zanahoria | 115.5 | 8 % | no comparable Salto series in the observatory | |||
| Maíz | 73.0 | 5 % | no comparable Salto series in the observatory | |||
| Morrón | 67.0 | 5 % | Morrón Rojo | 45 % | −0.44 | high |
| Frutilla | 55.7 | 4 % | Frutilla | 53 % | −0.85 | high |
| Kabutiá | 46.5 | 3 % | Zapallo Kabutiá | 58 % | −0.33 | medium |
| Melón | 41.1 | 3 % | Melón Reticulado | 47 % | −0.64 | high |
| Zapallito | 24.9 | 2 % | Zapallito | 63 % | −0.70 | high |
| Sandía | 24.8 | 2 % | no comparable Salto series in the observatory | |||
All 27 products, one by one
| Product | Real volatility 2021–25 | Price–volume correlation | Yearly UAM volume (t) |
|---|---|---|---|
| Frutilla | 53 % | −0.85 | 3,744 |
| Cebolla Verdeo | 34 % | −0.71 | 478 |
| Tomate Perita | 40 % | −0.70 | 2,183 |
| Zapallito | 63 % | −0.70 | 6,659 |
| Naranja Navel/Ombligo | 64 % | −0.69 | 9,755 |
| Melón Reticulado | 47 % | −0.64 | 2,165 |
| Cebolla Roja | 53 % | −0.58 | 2,551 |
| Chaucha Chata | 31 % | −0.56 | 240 |
| Pepino | 53 % | −0.46 | 1,923 |
| Tomate Redondo | 44 % | −0.46 | 19,009 |
| Morrón Rojo | 45 % | −0.44 | 9,739 |
| Tomate Cherry | 47 % | −0.44 | 2,008 |
| Berenjena | 40 % | −0.41 | 2,048 |
| Morrón Amarillo | 36 % | −0.41 | 395 |
| Boniato Criollo | 46 % | −0.38 | 9,915 |
| Zapallo Kabutiá | 58 % | −0.33 | 8,121 |
| Arándanos | 39 % | −0.30 | 182 |
| Boniato Zanahoria | 48 % | −0.25 | 9,052 |
| Cebolla | 46 % | −0.15 | 18,533 |
| Melón Amarillo | 19 % | −0.15 | 662 |
| Morrón Verde | 38 % | −0.13 | 5,255 |
| Naranja Valencia | 46 % | −0.09 | 13,719 |
| Pomelo Blanco | 50 % | −0.07 | 173 |
| Pomelo Rosado | 38 % | −0.07 | 379 |
| Calabacín | 54 % | −0.01 | 8,338 |
| Limón | 56 % | 0.22 | 8,908 |
| Zapallo Criollo | 13 % | 0.49 | 254 |
High risk: correlation ≤ −0.40 and volatility ≥ 40%; medium: one of the two; low: neither. Reference-row prices deflated with the CPI; UAM volumes per product. Carrot, maize and watermelon have no comparable Salto series in the observatory. The correlation mixes seasonality and oversupply: a signal for comparing products, not an elasticity.
04 / 07
The Central Hortícola, seen from Montevideo
The CHN opened on 1 June 2026. The question asked most often is whether Salto has sent less to Montevideo since. It can only be answered with the UAM monthly bulletins (June, July, August and September 2026), because the historical series per product stop at May 2026 and the origin breakdown (what share comes from Salto) is published once a year, in the yearbook. The first column shows how each product was doing before the CHN (January–May 2026 against 2025); the next ones, each month's tonnes with the year-on-year change and the change against the five-year average; the last, the latest month's wholesale price against the same month of 2025.
| Product | Before the CHN Jan–May 2026 vs 2025 | June 2026 t · vs 2025 · vs 5-yr avg | July 2026 t · vs 2025 · vs 5-yr avg | August 2026 t · vs 2025 · vs 5-yr avg | September 2026 t · vs 2025 · vs 5-yr avg | September price vs 2025 |
|---|---|---|---|---|---|---|
| Tomate | +3 % | 1,222 +11 % · +3 % | 1,269 +4 % · 0 % | 1,124 −27 % · −22 % | 1,127 −34 % · −28 % | +138 % |
| Morrón Rojo | −1 % | 613 +8 % · −16 % | 492 −28 % · −35 % | 474 −24 % · −42 % | 600 −11 % · −30 % | −34 % |
| Morrón Verde | +38 % | 481 +19 % · +26 % | 478 +24 % · +22 % | 421 +24 % · +4 % | 349 −8 % · −23 % | +43 % |
| Zapallito | −3 % | 408 +47 % · +8 % | 222 +30 % · −36 % | 259 +50 % · −11 % | 491 +1 % · +5 % | +22 % |
| Berenjena | +9 % | 133 +23 % · −9 % | 118 +7 % · −13 % | 69 −42 % · −54 % | 81 −46 % · −57 % | +138 % |
| Pepino | +54 % | 214 +93 % · +163 % | 240 +138 % · +259 % | 215 +43 % · +122 % | 151 −20 % · +2 % | −18 % |
| Frutilla | +30 % | 115 −35 % · −33 % | 275 −2 % · −6 % | 368 −5 % · −12 % | 407 −23 % · −16 % | +29 % |
| Calabacín | +5 % | 853 −15 % · +11 % | 990 −10 % · +13 % | 909 −20 % · +5 % | 947 −13 % · +8 % | +58 % |
| Zapallo Kabutiá | +4 % | 742 −18 % · −10 % | 889 −6 % · +5 % | 722 −22 % · −15 % | 730 −24 % · −7 % | +93 % |
| Boniato | +19 % | 1,978 −10 % · +2 % | 2,157 −7 % · +7 % | 1,753 −15 % · −9 % | 1,819 −20 % · −7 % | +94 % |
| Cebolla | +5 % | 1,744 +1 % · −8 % | 1,785 +11 % · −21 % | 1,762 −6 % · −9 % | 1,981 +210 % · +103 % | −27 % |
| Naranja | +7 % | 2,835 +15 % · +29 % | 2,761 +14 % · +27 % | 2,229 −5 % · −2 % | 2,595 +4 % · +19 % | −25 % |
| Mandarina | 0 % | 2,524 +4 % · −10 % | 2,757 +2 % · −13 % | 1,444 −48 % · −55 % | 3,484 +18 % · +4 % | −47 % |
| Limón | −4 % | 625 −7 % · +7 % | 679 +11 % · +32 % | 621 −15 % · +3 % | 710 −14 % · +21 % | −36 % |
| Melón | −1 % | 35 −26 % · +29 % | 22 −66 % · −45 % | 49 +103 % · +31 % | 96 +32 % · +78 % | +10 % |
| Sandía | −8 % | 31 −64 % · −22 % | 28 −46 % · −13 % | 33 −42 % · −17 % | 289 +15 % · +210 % | −21 % |
| UAM total | +7 % | 31,218 −2 % · +3 % | 32,308 +2 % · +1 % | 28,234 −12 % · −11 % | 33,456 −4 % · +3 % |
And in price: the Salto–Montevideo gap, trading day by trading day
Every CHN trading day covered by the press, paired with the nearest UAM bulletin (up to four days apart). Positive gap: Salto dearer than the Montevideo reference; negative, cheaper. 16 products with at least one paired day.
| Product | Days | Mean gap | $/kg |
|---|---|---|---|
| Tomate Perita | 1 | −38 % | −75.0 |
| Berenjena | 3 | −32 % | −35.5 |
| Naranja Navel/Ombligo | 2 | −22 % | −5.0 |
| Morrón Rojo | 1 | −20 % | −22.5 |
| Mandarina Avana/Montenegrina | 2 | −20 % | −5.8 |
| Tomate Cherry | 2 | −18 % | −45.0 |
| Morrón Verde | 3 | −12 % | −15.0 |
| Zapallito | 3 | −9 % | −12.8 |
| Zapallo Kabutiá | 3 | −8 % | −2.8 |
| Limón | 3 | +5 % | +0.8 |
| Pepino | 2 | +6 % | 0.0 |
| Tomate Redondo | 3 | +7 % | +7.5 |
| Frutilla | 3 | +12 % | +12.5 |
| Calabacín | 3 | +13 % | +3.2 |
| Boniato Zanahoria | 3 | +16 % | +6.7 |
| Cebolla | 3 | +25 % | +10.3 |
UAM monthly fruit-and-vegetable bulletin: tonnes entered per product, with the same month's average over the five previous closed years and the same month of the previous year. The “before the CHN” column comes from the Observatorio Granjero historical series (varieties summed). Gap: CHN midpoint over the UAM reference-row midpoint, minus one; it compares similar, not identical, grades.
05 / 07
Buy in Salto or in Montevideo? And how many kilometres are saved
For a northern retailer (Salto, Paysandú, Artigas, Rivera, Tacuarembó) the sum is simple: buying at the CHN pays when the gap in pesos per kilo is smaller than the freight per kilo from Montevideo. There is no current public tariff for fruit-and-vegetable freight, so it is shown as a range: a full truck Montevideo–Salto (about 500 km) at 40, 60 or 80 thousand pesos per trip, carrying 10 or 20 tonnes.
| Freight per trip ($) | Load (t) | Freight per kilo ($) |
|---|---|---|
| 40,000 | 10 | 4.0 |
| 40,000 | 20 | 2.0 |
| 60,000 | 10 | 6.0 |
| 60,000 | 20 | 3.0 |
| 80,000 | 10 | 8.0 |
| 80,000 | 20 | 4.0 |
The kilometres
Salto supplied 28.2 % of everything that entered the UAM in 2025 (UAM 2025 yearbook): of 418,792 tonnes, about 118,100. At 20 tonnes per truck that is close to 5,900 trips of 500 km a year, some 3.0 million kilometres and in the order of 2,600 tonnes of CO₂e (DEFRA 2025 factor for an articulated lorry with average load, 0.891 kg per km, excluding fuel production). That journey will go on as long as Montevideo eats Salto tomatoes; what the CHN can avoid is the return leg: produce that was sold in Montevideo and came back north in another truck to be sold 500 km from where it was picked. How much that was, nobody publishes. So what follows is an estimator, not a measurement: every 1,000 tonnes traded in Salto instead of going there and back avoids this.
| Load per truck (t) | Trips avoided | km avoided | t CO₂e (combustion) | t CO₂e (incl. diesel production) |
|---|---|---|---|---|
| 10 | 100 | 100,000 | 89.1 | 110.3 |
| 20 | 50 | 50,000 | 44.5 | 55.1 |
Scenarios, at 20 tonnes per truck and 1,000 km round trip. They are hypotheses: the tonnes column is the missing figure.
| Tonnes a year that stop going there and back | 20-t trips | km | t CO₂e |
|---|---|---|---|
| 2,000 | 100 | 100,000 | 89 |
| 5,000 | 250 | 250,000 | 223 |
| 10,000 | 500 | 500,000 | 446 |
| 20,000 | 1,000 | 1,000,000 | 891 |
Salto–Montevideo distance by Routes 3 and 1, rounded to 500 km. Emission factors: DEFRA/DESNZ 2025, articulated HGV with average load, 0.891 kg CO₂e per km tank-to-wheel and 0.212 kg per km for fuel production (UK Government GHG conversion factors 2025). Salto's share of UAM entries: UAM 2025 yearbook. Load per truck and freight per trip: assumptions, stated in each table. If you have a real Montevideo–Salto freight quote for fruit and vegetables, or the tonnes sold at the CHN, send it: it replaces the assumption.
06 / 07
Method, limits and what is missing
Constant pesos
Prices are deflated with INE's headline CPI (base October 2022 = 100), monthly series, to pesos of the latest published month (August 2026). Later months use the latest index; the error is a few tenths of a point. INE series.
Decade percentile
Share of the same months in the ten previous years with a lower real price than this year. With ten observations each step is worth ten points: 100 means “dearer than any of the ten”, not an all-time record.
Window and premium
Each period (2015–19 and 2021–25) with its own window, defined on its own seasonal index, so the shift of the window and the change in the premium are measured separately. 2020 is left out of both periods. A product with no month at 110%, or with more than six, in either period is not shown.
Volatility and correlation
Coefficient of variation of the monthly real price (2021–25) and Pearson correlation between the log of UAM entries and the log of the real price (2015–25). Both use the UAM reference row and UAM volumes: they describe Montevideo's market, which is where the price that rules the north is formed.
The CHN months
UAM monthly fruit-and-vegetable bulletin, entry and price tables per product, parsed from the PDF. June, July, August and September 2026 for now; each new month is added when the UAM publishes its bulletin. No origin breakdown until the 2026 yearbook.
Freight and CO₂
An estimator with explicit assumptions: distance, load per truck, freight per trip and emission factor. Not a measurement of what the CHN avoids, because the volume that went there and back is not published.
What is missing
Tonnes sold at the CHN per product and month; UAM entries by department of origin at monthly frequency; a real Montevideo–Salto freight quote for fruit and vegetables; and northern retail prices, to close the chain. With any one of those four figures this page improves immediately.
The files behind every table (the CPI as CSV, the parsed monthly bulletin and the JSON with all the crosses) are on Data & methodology, next to the observatory series. If you redo a sum and get a different answer, write in: it gets corrected and credited.
07 / 07 · Contact
If you redo a sum and get a different answer
It gets corrected and credited.